Year in Music 2015
SPOTIFY
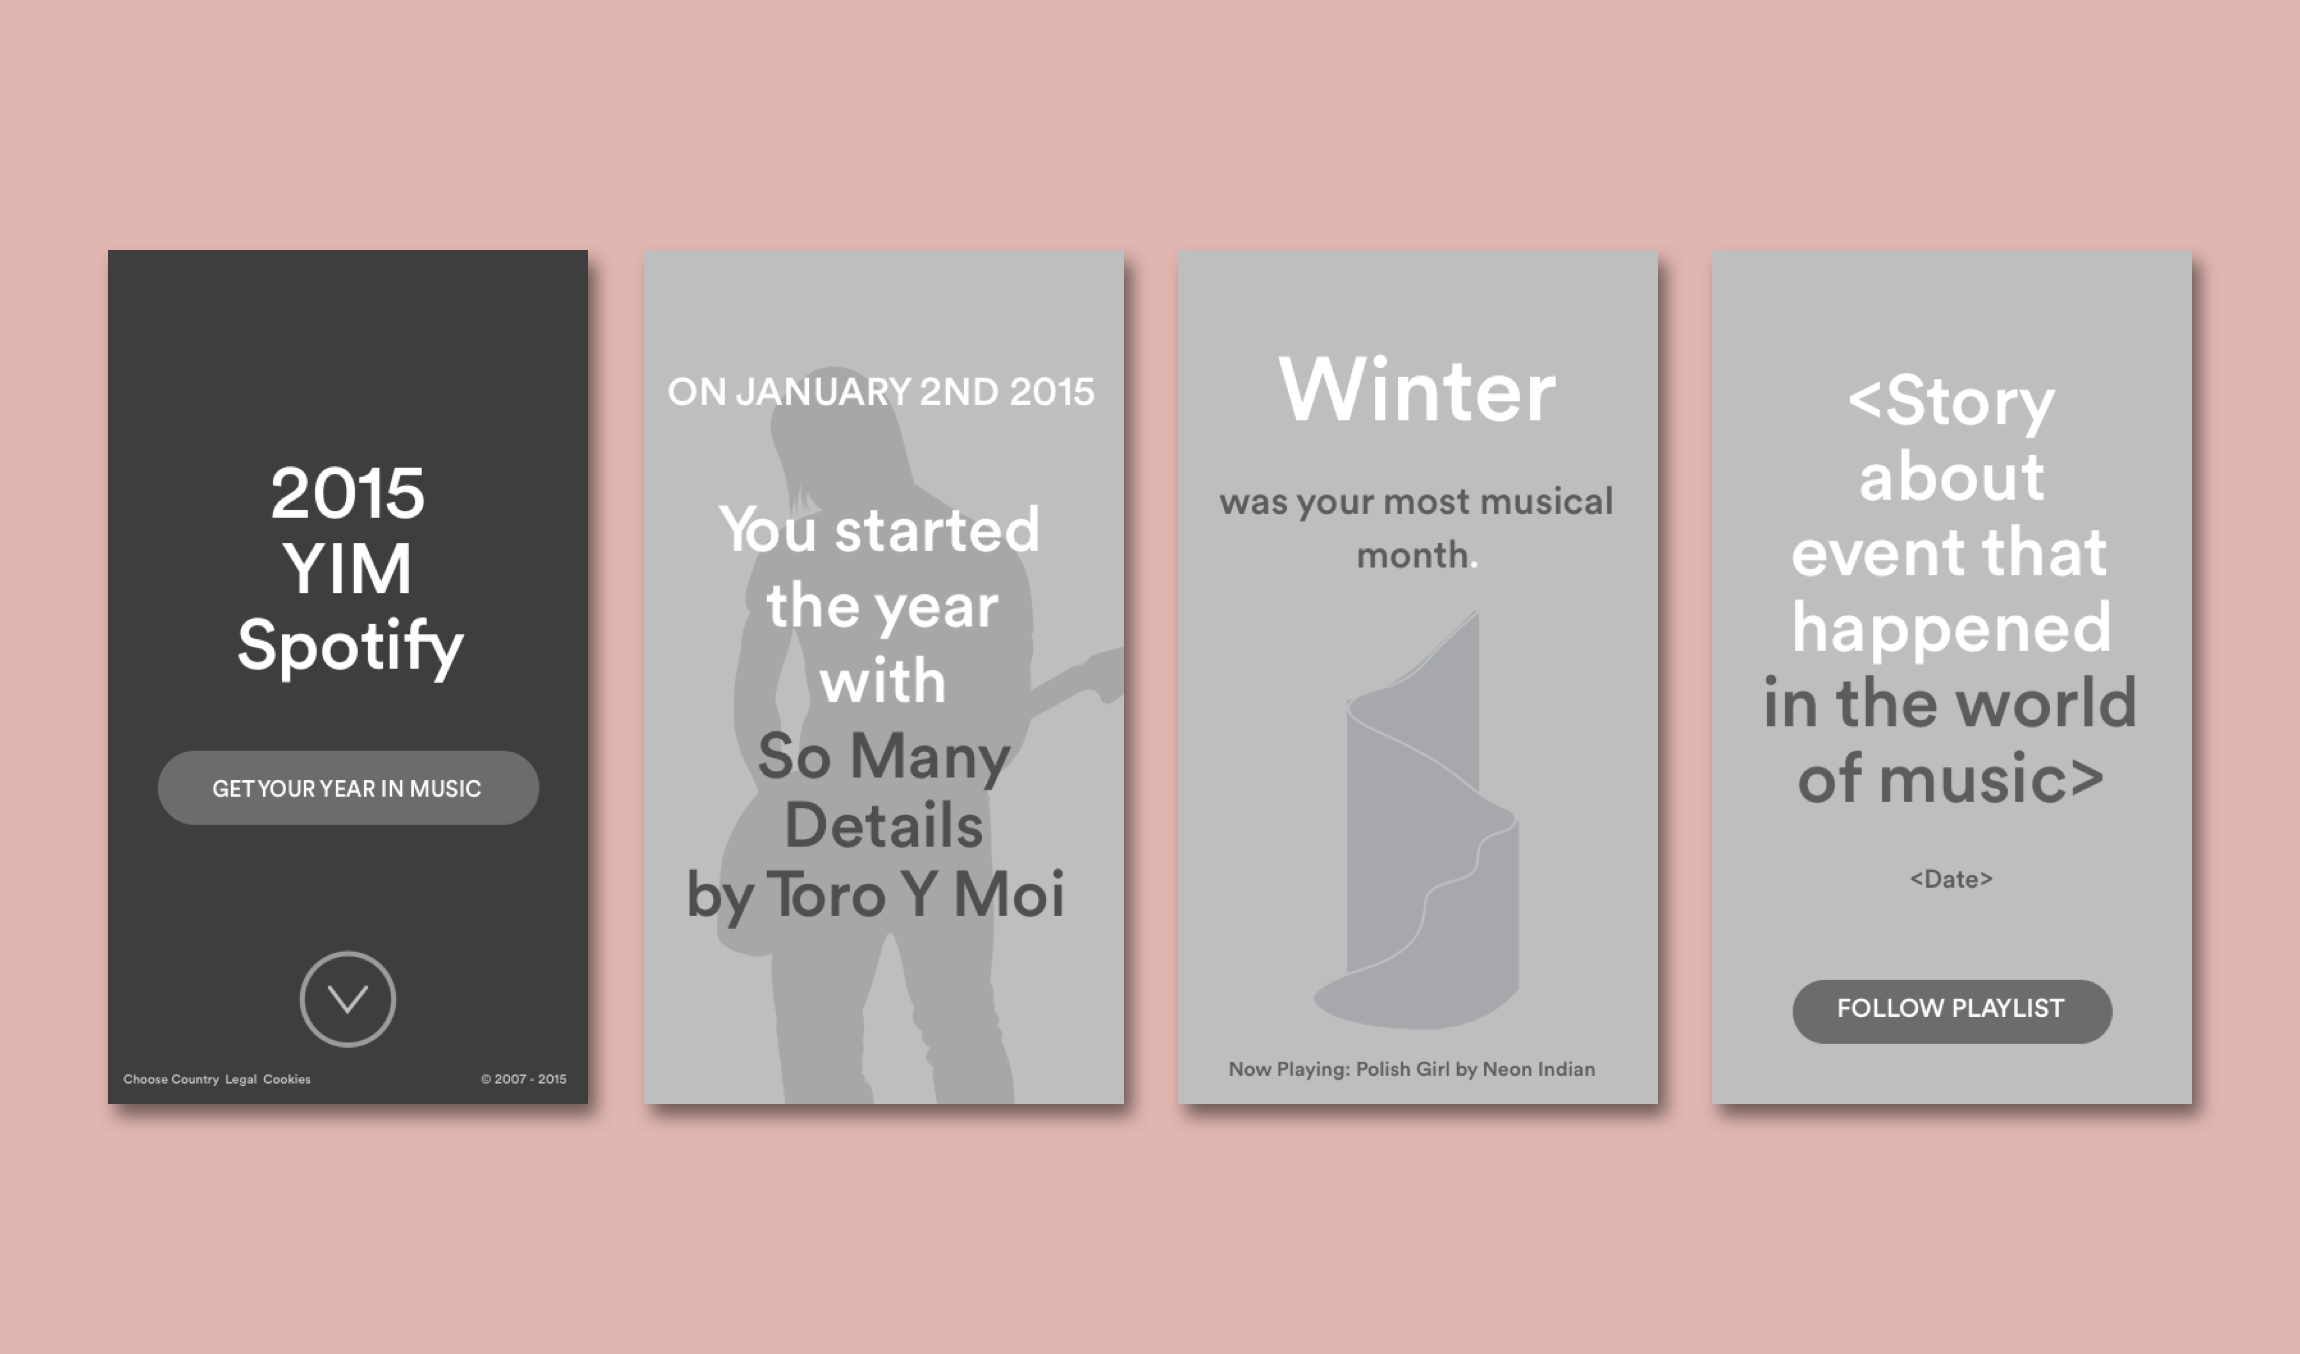
Spotify let users relive the moments and music that made up 2015.
In celebration of the hundred year anniversary of the National Parks Service, we created an interactive tour of five of America’s most beautiful national parks led by real park rangers.
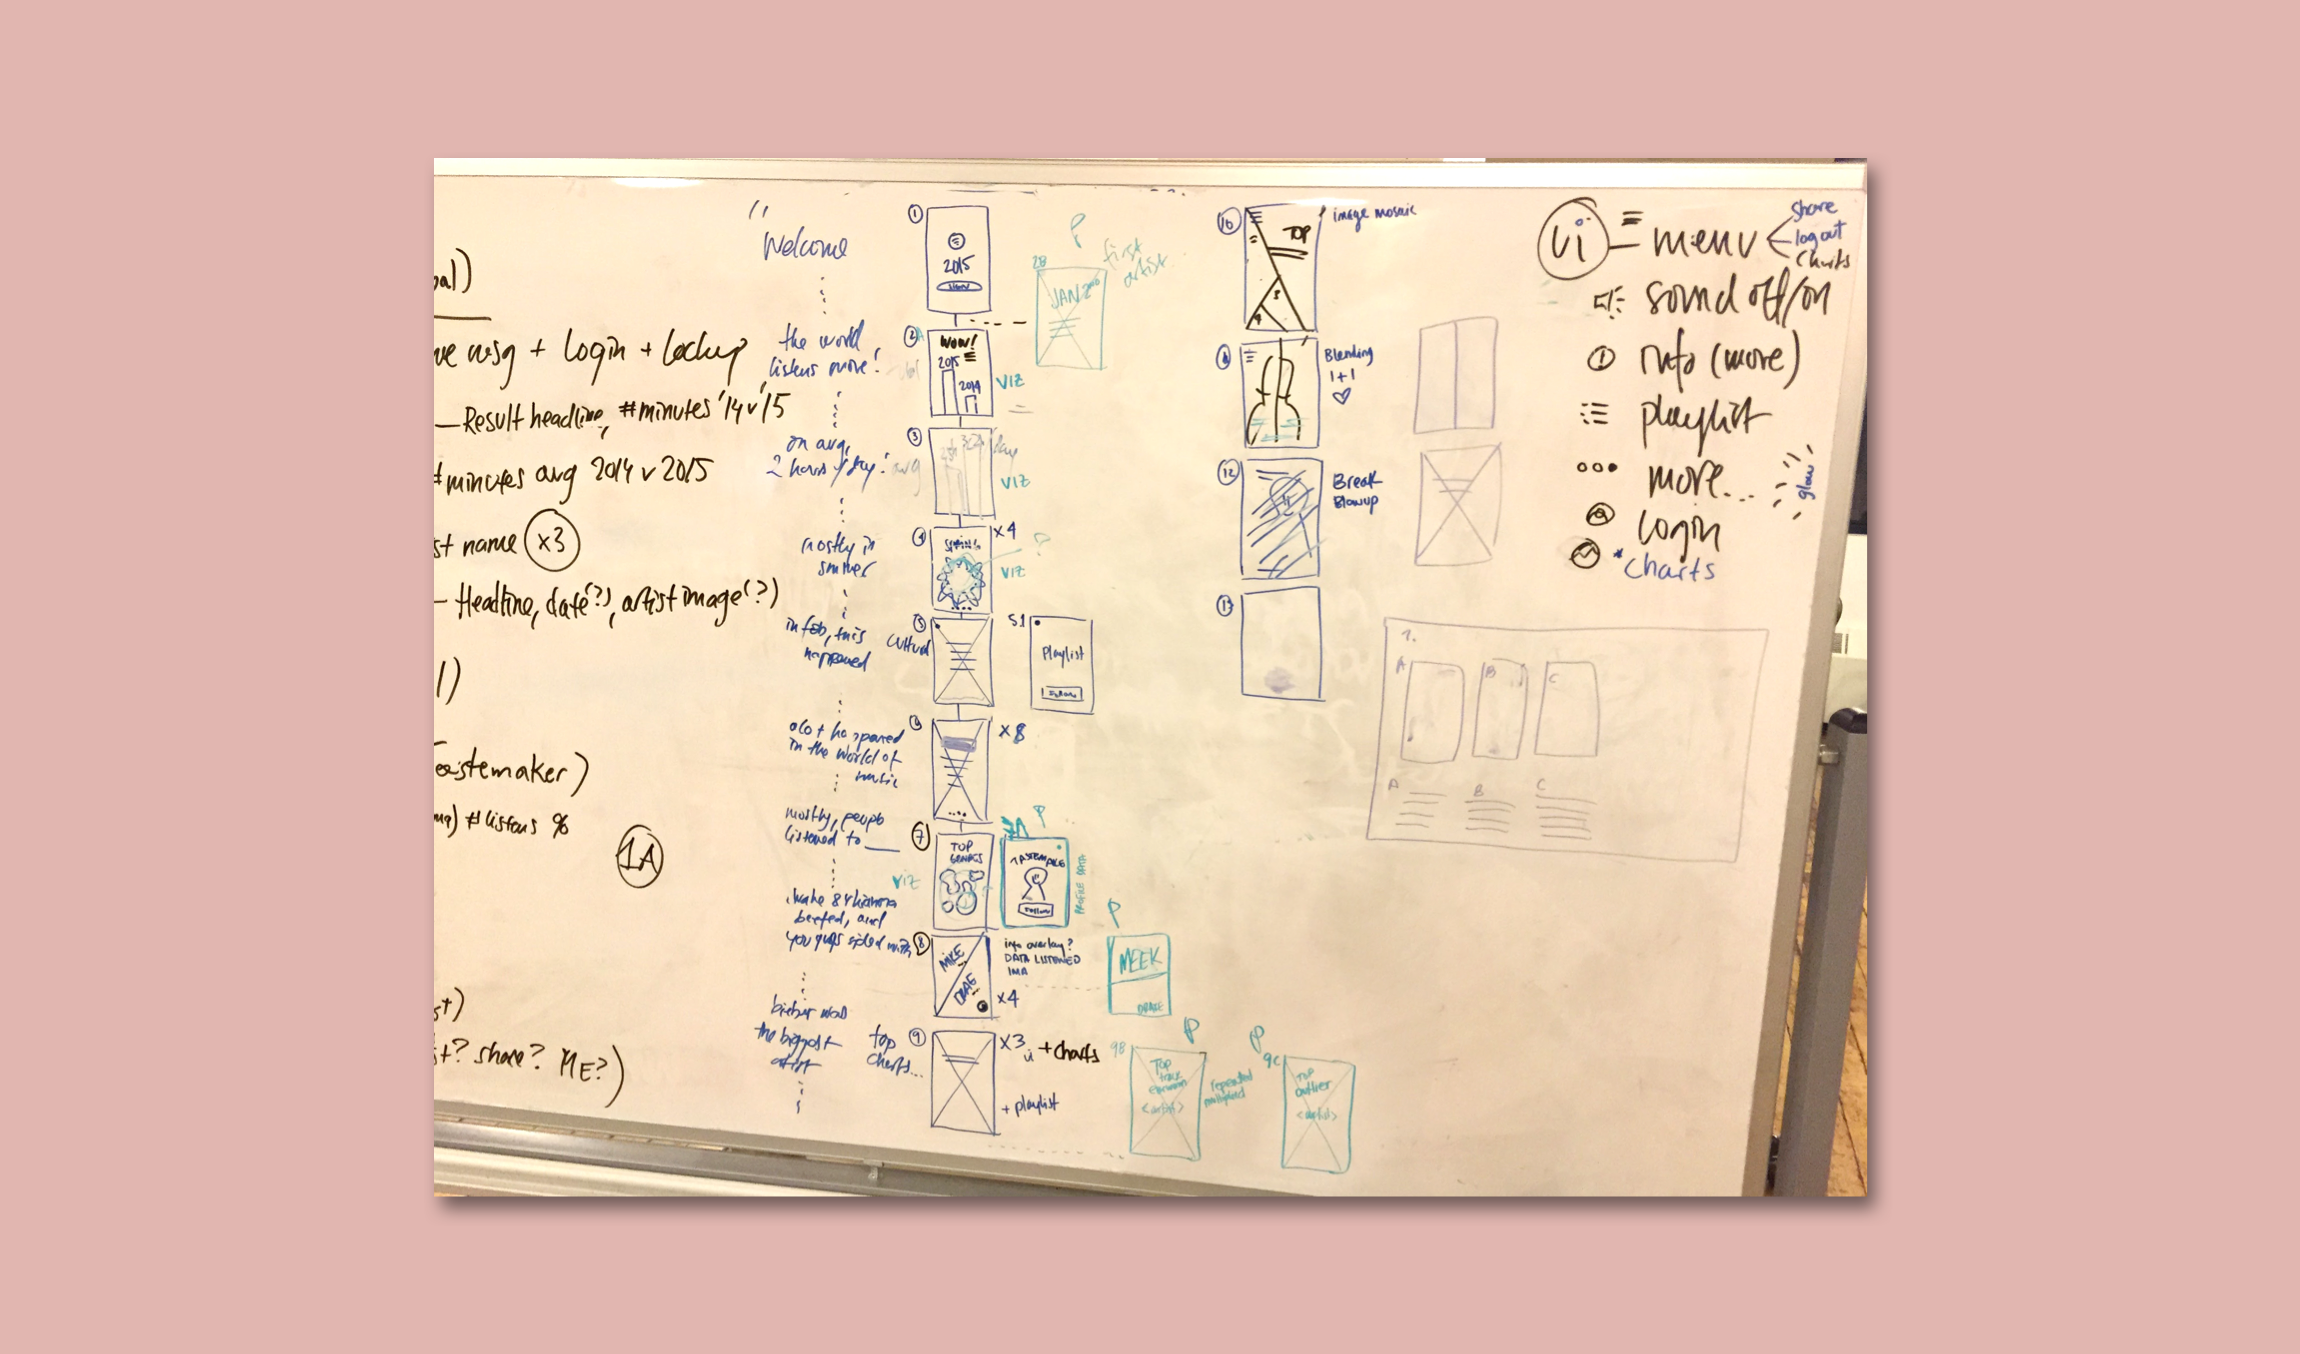
EARLY FLOW AND WIREFRAME SKETCHES
About the Project
From global data to personal insights, users could explore theirs top listens and the world’s. With an audience of millions, we needed to create an experience that captured Spotify’s connection to both music and culture using a large amount of data. We worked alongside Spotify to concept, write, design, and build the Year in Music campaign as well as supporting media that included digital display advertising, OOH advertising, and short online spots.
Using 16:9 video, 360° video and ambisonic audio, users were able to partake in experiences the average park visitor never gets to see. We shot from helicopters, mountain tops, horseback, and underwater, resulting in over eleven terabytes of footage gathered over twenty-six days and 18,949 miles, edited down to a final experience of twenty-five minutes.
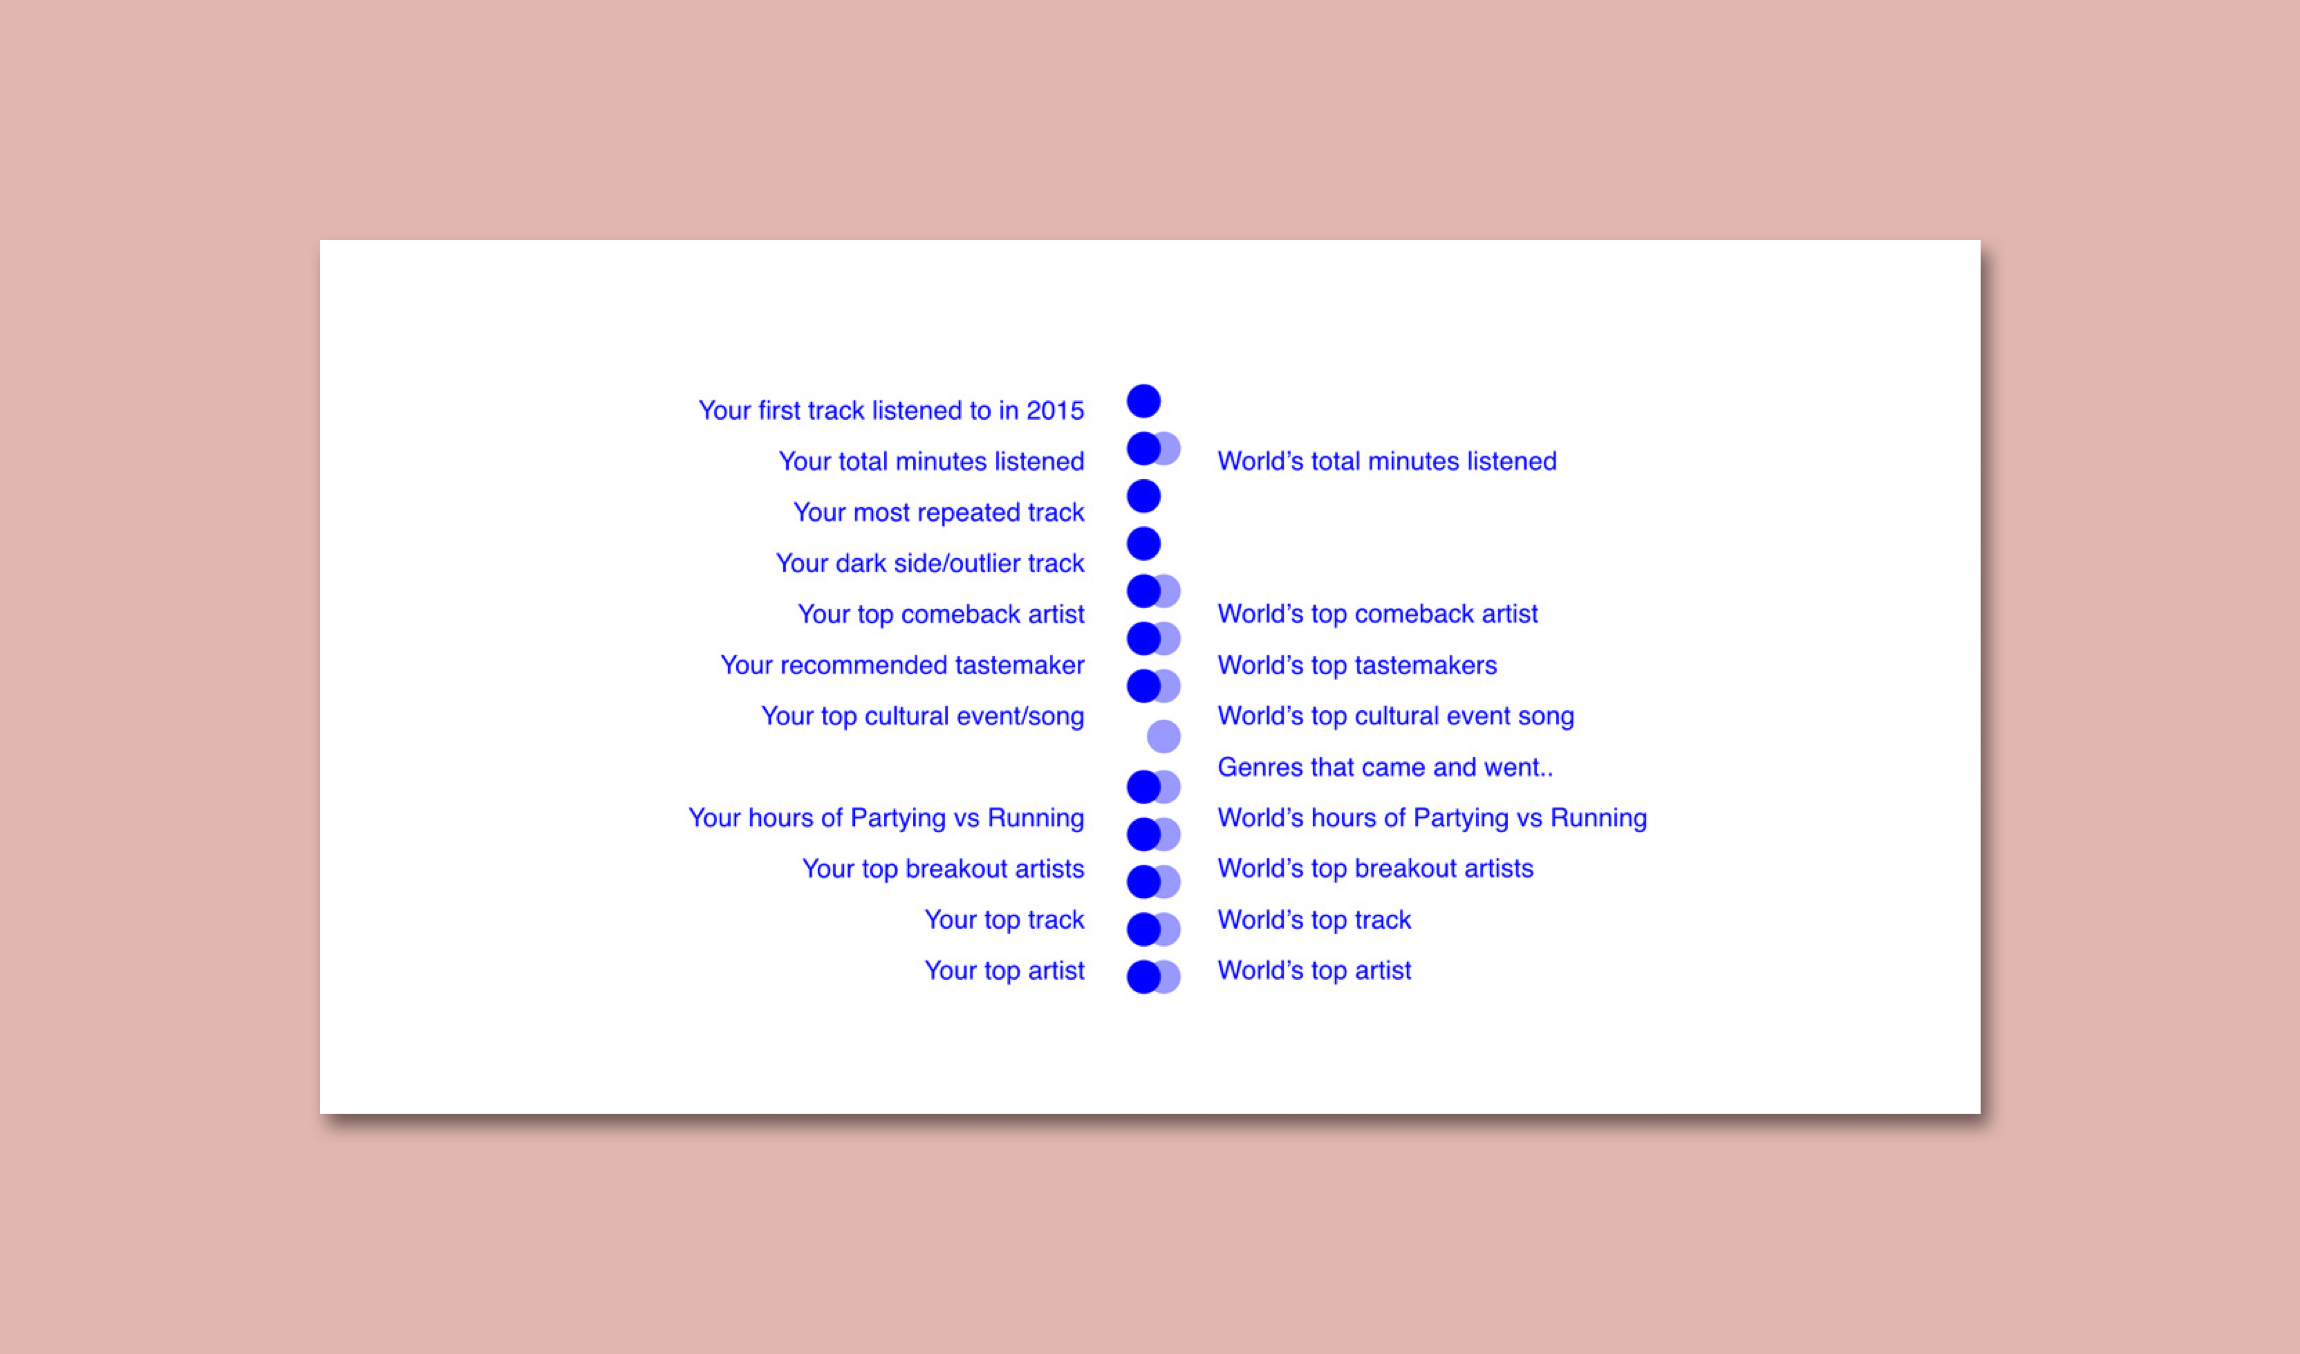
BREAK DOWN OF LOGGED IN EXPERIENCE AND GLOBAL (LOGGED OUT) EXPERIENCE
Multiple options for the global flow of the site- guided tour verse exploritory.
UX Challenges
Spotify users who logged in got personalized information about their listening habits, while users who didn't log in only got information about their country's data. Both experiences needed to feel immersive and share-worthy.
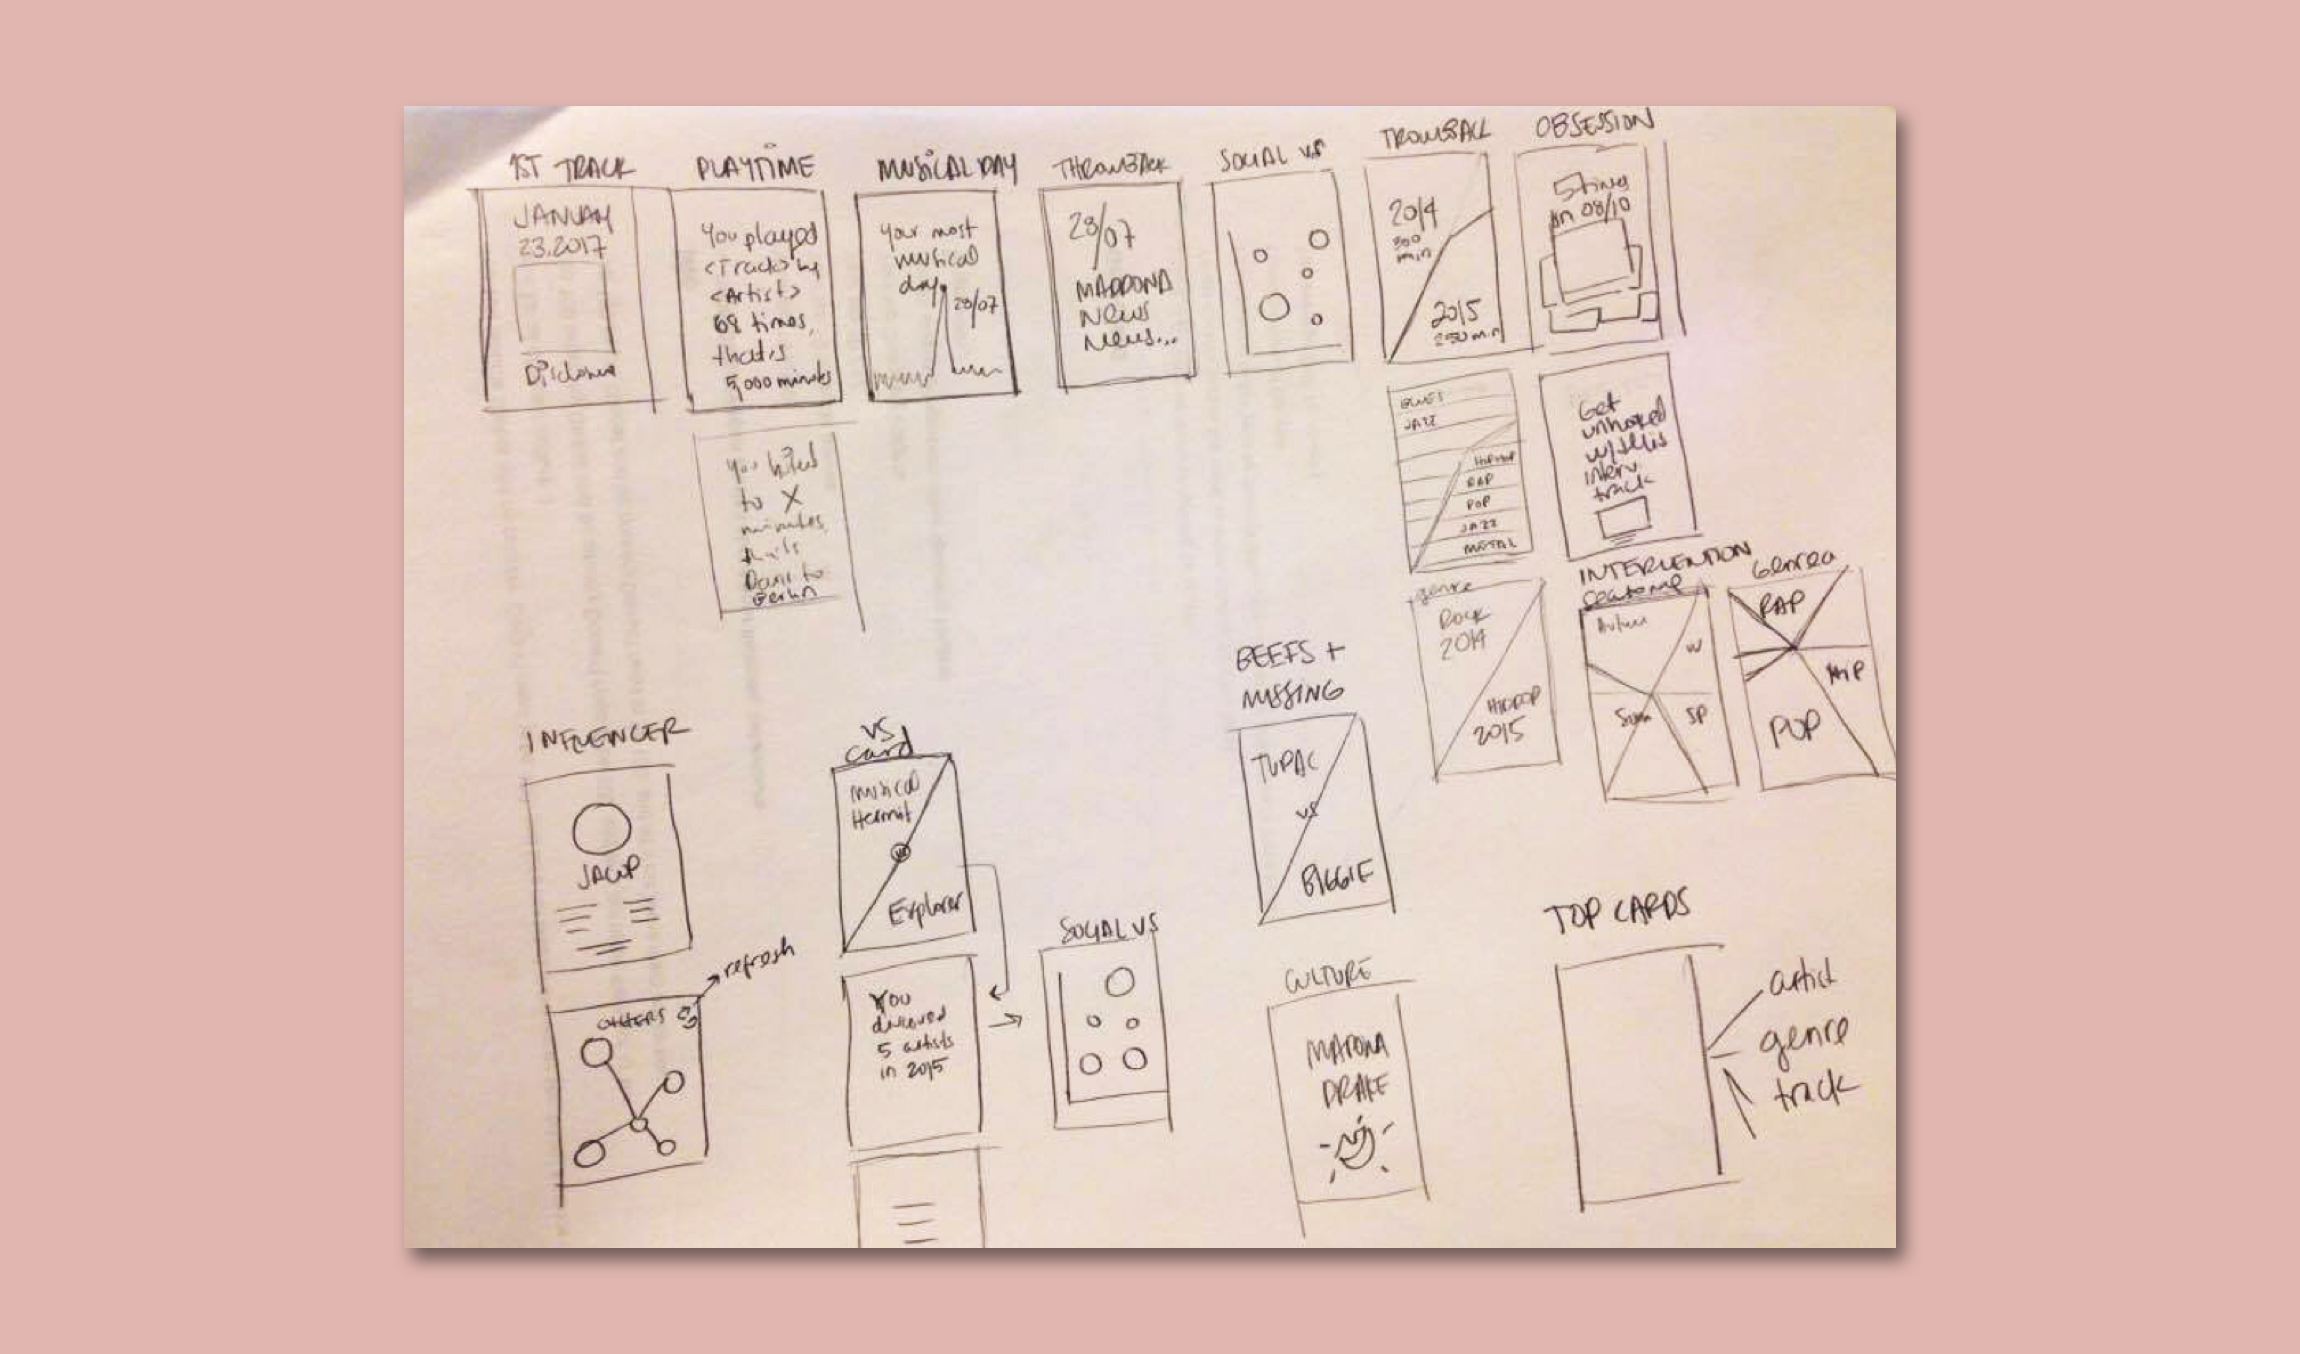
EARLY SKETCHES OF FLOW AND SCREENS
Since this experience was translated into 35 different languages for 52 countries, we had to think through multiple levels of affordances. All 45 pages had to work seamlessly for character based language and languages with different sentence structures while integrated automated data. We included seasonal data, but had to create affordances for countries in different hemispheres where the seasons flip.
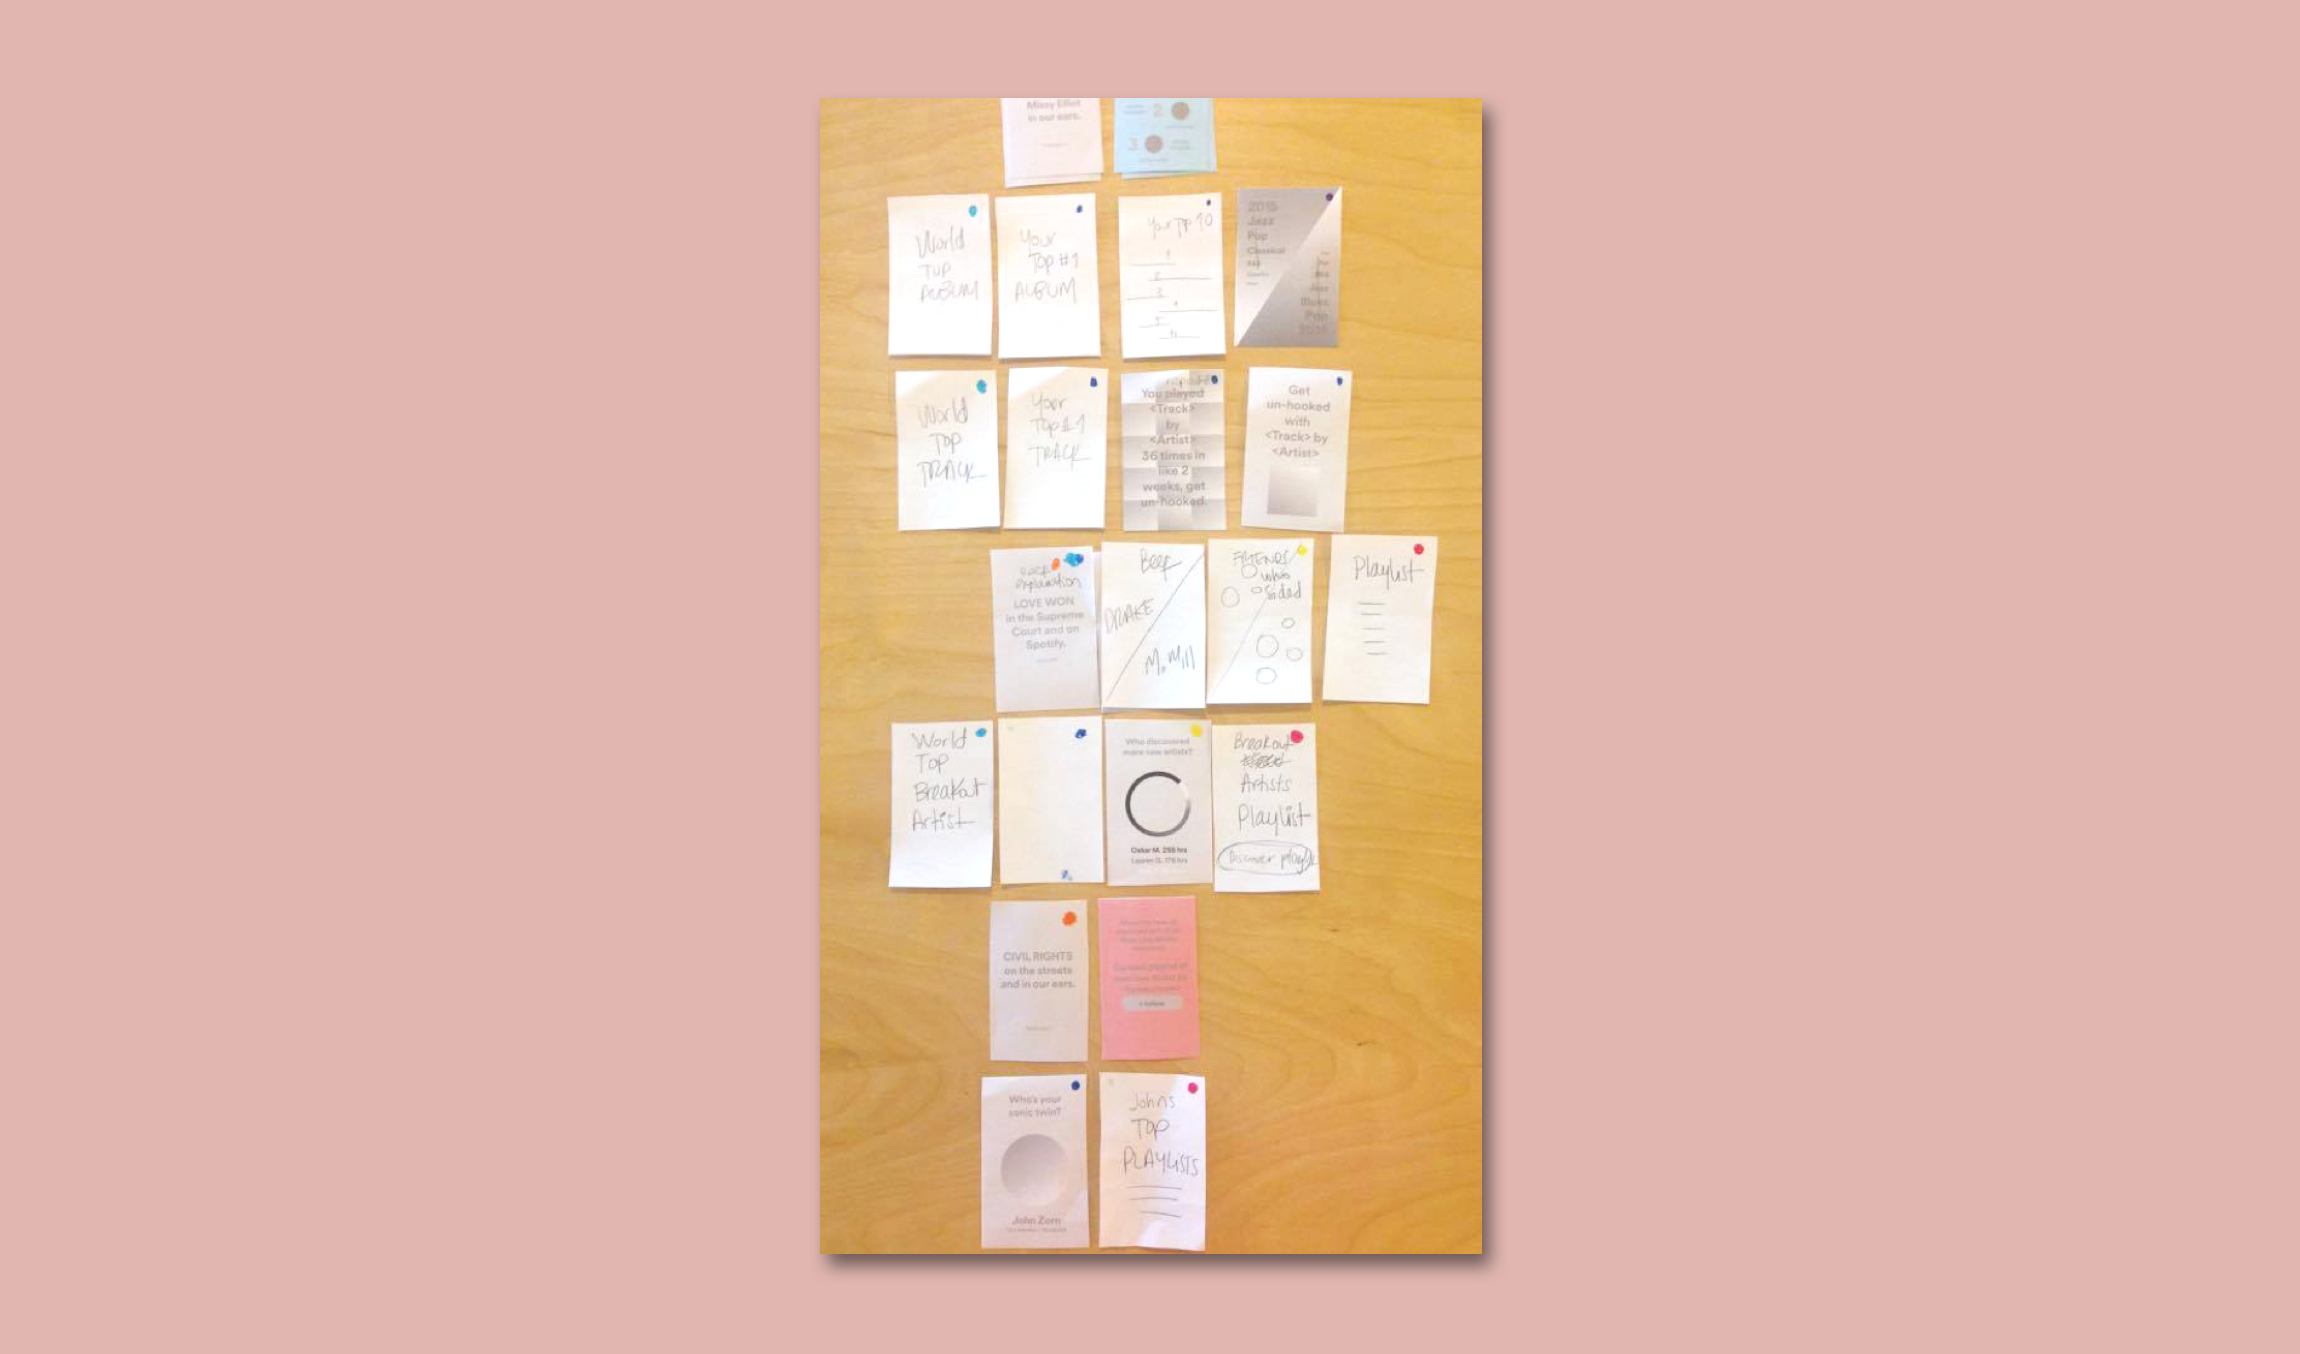
PAPER PROTOTYPES OF MOBILE SCREENS
The experience was long and complex- including 45 pages. We had to create a navigation pattern that allowed users to understand where they were in the flow and persistently share.
MOBILE WIREFRAMES
UX Solutions
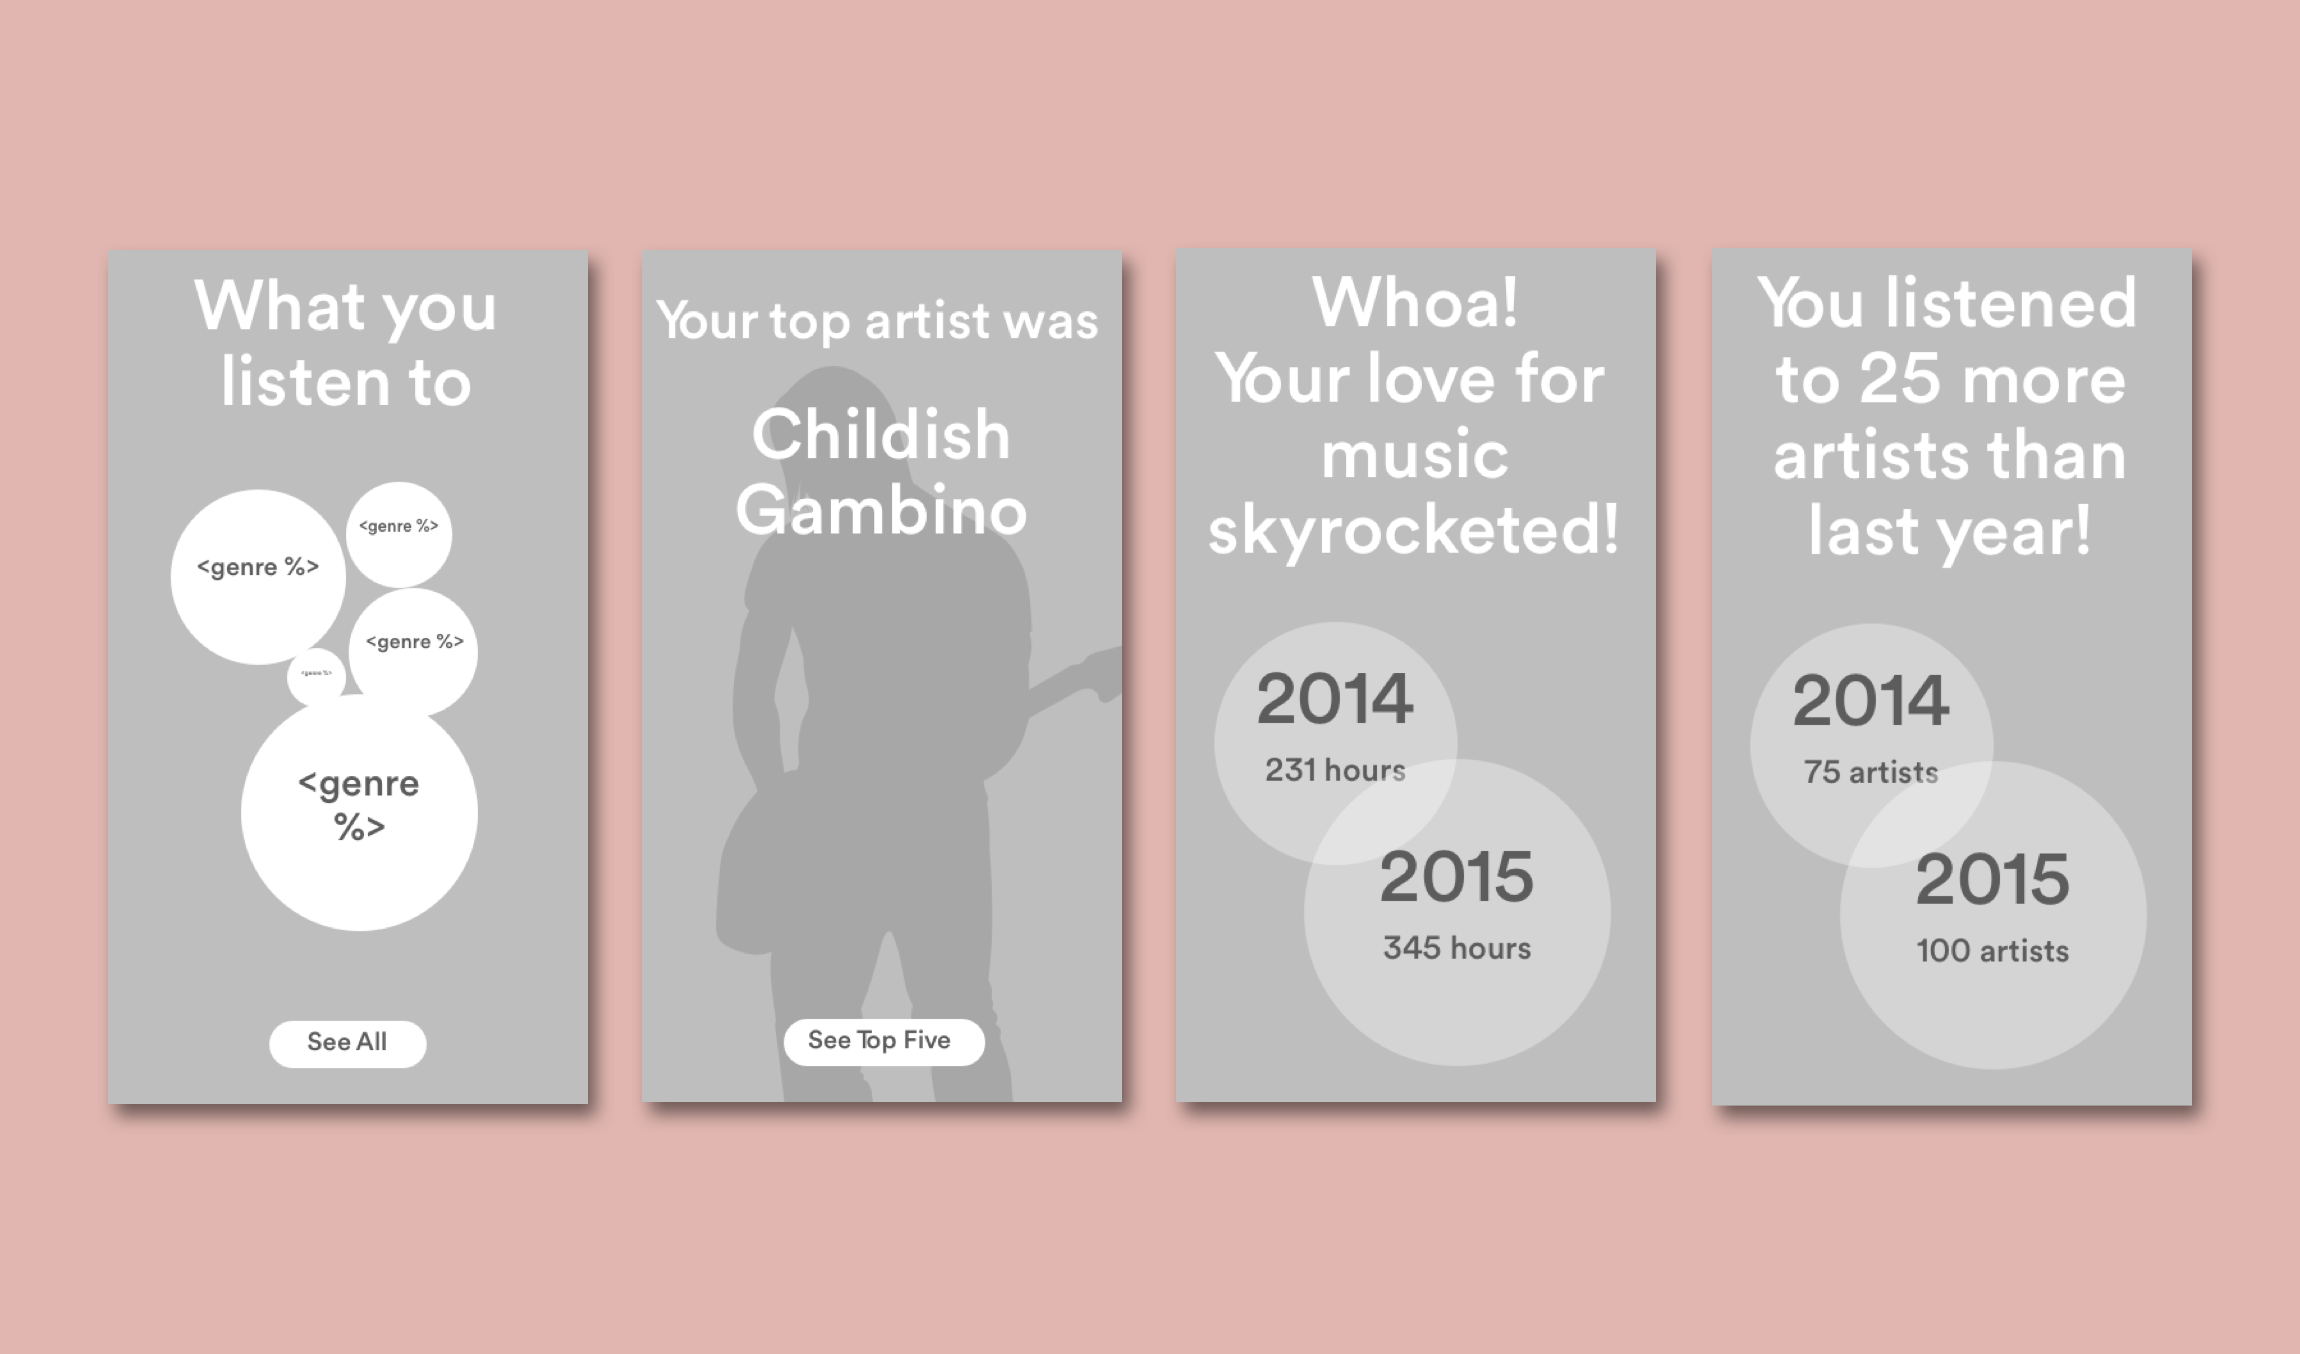
We created two ways of exploring the data and stories: personalized experience for Spotify users or a global experience for non-Spotify users. The personalized experience demonstrates the detail Spotify’s user data. For instance, logged-in users saw: “What song helped you ring in the year,” “Which artists soundtracked your seasons,” “What was your weirdest outlier (most out of place song you listened to),” and “What were the stories from music and culture that made your year?” While the global user would general data from their country: top artists, top tracks, etc.
MOBILE WIREFRAMES
To make sure the site could be accessed globally in multiple languages, we built a custom CMS so the Spotify team could switch the copy and content depending on the language and country.
The site’s structure was based in the seasons of 2015. The logged in user starts the experience with their first song of 2015. As the user scrolls, they progress through the year. When the user reaches a data point, “How many minutes did you listen in 2015?” the user would have a share button available so they can easily download the image or share directly to Facebook and Twitter. Users could jump ahead to different sections by using the hamburger nav that listed out all the main sections of the experience.